Maternal antibodies
maternal_antibodies.Rmd
library(seropackage)
knitr::opts_chunk$set(echo = TRUE)
For many pathogens, offsprings inherit maternal antibodies from their mothers. Maternal antibodies are typically short-lived but can corrupt the inference of natural infection if serological samples from infants are included in an analysis.
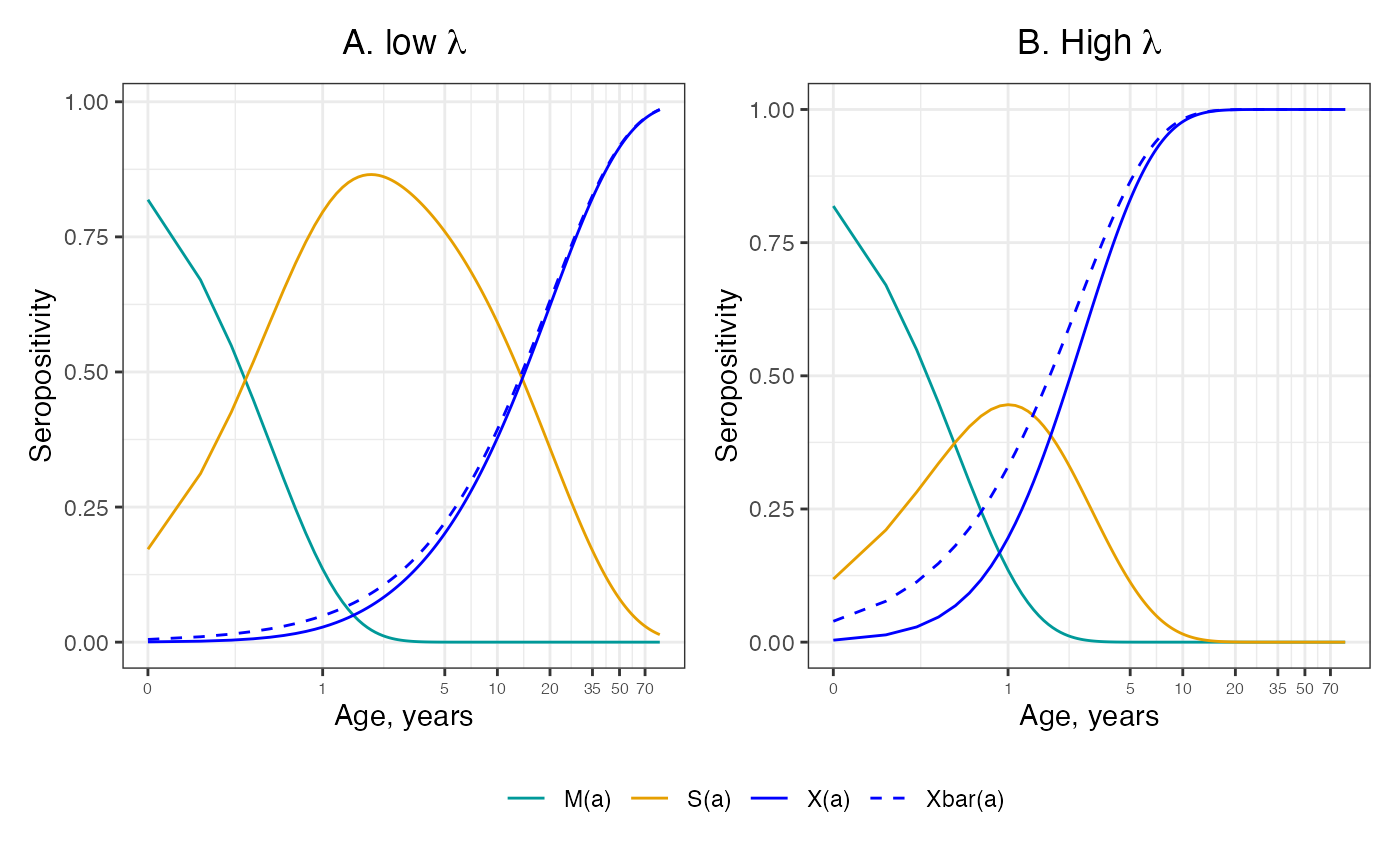
In this article, we consider the situation where FOI is constant and there is no seroreversion. To accounted for the maternal antibodies in our model, we assume that only after individuals have cleared their maternal antibodies can they become naturally infected, and also assume that the rate of loss of maternal antibodies is independent of age.
# functions for the system equation solutions:
constant_foi <- function(a, lambda, rho){
  prop_m = exp(-rho*a) # maternal antibodies
  prop_s = (rho/(rho+lambda))*(exp(-lambda*a) - exp(-rho*a)) # susceptible proportion
  prop_x = ((rho*(1-exp(-lambda*a))) - (lambda*(1-exp(-rho*a))))/(rho-lambda) # seropositive proportion v1
  prop_x2 = 1-exp(-lambda*a) # seropositive proportion v2

  return(c(prop_m, prop_s, prop_x, prop_x2))
}

ages <- seq(0.1,85,by=0.1)
Scenario where the rate of decay of maternal antibodies ( = 2) is higher than the force of infection ( = 0.05), i.e :
gamma <- 2; lambda = 0.05
prop_seropos_df <- data.frame()
for(age in ages){
  out = constant_foi(age, lambda, gamma)
  prop_seropos_df = rbind(prop_seropos_df, c(age, out))
}

colnames(prop_seropos_df) <- c("age", "prop_m", "prop_s", "prop_x", "prop_x2")
prop_seropos_df1 <- melt(prop_seropos_df, id.vars = c("age"), variable.name = "compartment", value.name = "Proportion")

figA <- prop_seropos_df1 %>%
  ggplot(aes(x = age, y = Proportion, color = as.factor(compartment), linetype = as.factor(compartment))) +
  geom_line() +
  scale_color_manual(values = c("prop_m"="#009999", "prop_x"="#0000FF", "prop_s"="#E69F00",
                                "prop_x2"="#0000FF")) +
  scale_linetype_manual(values = c("prop_m"="solid", "prop_s"="solid", "prop_x"="solid",
                                   "prop_x2"="dashed")) +
  labs(x = "Age, years", y = "Seropositivity", title = expression(paste("A. low ", lambda))) +
  guides(linetype = "none", color = "none") +
  scale_x_continuous(trans="log10", breaks = c(0.1,1,5,10,20,35,seq(50,85,by=20)),
                labels = function(x){sprintf("%.0f", x)}) +
  theme_bw() +
  theme(plot.title = element_text(hjust = 0.5),
        axis.text.x = element_text(size = 6))
Scenario with higher force of infection (FOI = 0.4), i.e :
gamma <- 2; lambda = 0.4
prop_seropos_df2 <- data.frame()
for(age in ages){
  out = constant_foi(age, lambda, gamma)
  prop_seropos_df2 = rbind(prop_seropos_df2, c(age, out))
}

colnames(prop_seropos_df2) <- c("age", "prop_m", "prop_s", "prop_x", "prop_x2")
prop_seropos_df3 <- melt(prop_seropos_df2, id.vars = c("age"), variable.name = "compartment", value.name = "Proportion")

figB <- prop_seropos_df3 %>%
  ggplot(aes(x = age, y = Proportion, color = as.factor(compartment), linetype = as.factor(compartment))) +
  geom_line() +
  scale_color_manual(name = "",
                     values = c("prop_m"="#009999", "prop_s"="#E69F00", "prop_x"="#0000FF",
                                "prop_x2"="#0000FF"),
                     labels = c("M(a)", "S(a)", "X(a)", "Xbar(a)")) +
  scale_linetype_manual(name = "",
                        values = c("prop_m"="solid", "prop_s"="solid", "prop_x"="solid",
                                   "prop_x2"="dashed"),
                        labels = c("M(a)", "S(a)", "X(a)", "Xbar(a)")) +
  labs(x = "Age, years", y = "Seropositivity", title = expression(paste("B. High ", lambda)), linetype = "") +
  scale_x_continuous(trans="log10", breaks = c(0.1,1,5,10,20,35,seq(50,85,by=20)),
                labels = function(x){sprintf("%.0f", x)}) +
  theme_bw() +
  theme(plot.title = element_text(hjust = 0.5),
        axis.text.x = element_text(size = 6))
The horizontal axis is on the log scale, which cannot start at zero. The dashed lines shows the approximate solution given by neglecting the effect of maternal antibodies. The plorts show that when , it makes little difference to the modelled seropositive proportion to neglect the effect of maternal antibodies, but when , this induces bias in this proportion.
figA + figB + plot_layout(guides = "collect") & theme(legend.position = 'bottom')